
Three things to take away
What is the outlook for Canada’s trade in goods – and how is the geopolitical and economic landscape impacting growth prospects
What are the key risk areas for firms involved in global commerce in 2024
What can firms engaged with international trade do to mitigate risk and promote growth by tapping into diversification, research, insurance and other financial products
Canadian businesses face a variety of opportunities and challenges in an increasingly complex geopolitical environment. As policymakers in Canada seek to reduce economic ties to China nearshoring is a growing trend, while strained relations with India may increase the risk of sanctions or reduce cooperation.
Canadian trade rapidly recovered from the pandemic as exports and imports reached new highs, but high interest rates continue to pose a challenge for businesses, and the economy is slowing down. The coming years are likely to see governments in Canada and the rest of the world looking to ensure access to critical goods while navigating trade flow concerns through the filters of evolving regulations, geopolitical uncertainty, and near-shoring and onshoring trends.
Introduction
Canadian businesses faces a variety of opportunities and challenges in an increasingly complex geopolitical environment. As policymakers in Canada seek to reduce economic ties to China and boost production for semiconductors and clean energy technology, nearshoring is a growing trend. In addition, strained relations with India may increase the risk of sanctions or limit economic cooperation. Meanwhile in Ottawa, Prime Minister Justin Trudeau’s popularity is declining as the Conservatives ascend in the polls. However, an election is unlikely to occur until late 2024 or 2025.
Manufacturing is changing as global trend integration is being succeeded by an era of fragmentation. However, Canadian trade rapidly recovered from the pandemic as exports and imports reached new highs, despite tensions with partners like China. Nonetheless, high interest rates continue to pose a challenge for businesses, and the economy is slowing down and is likely entering a recession that will last into 2024. These factors will increase risks for the manufacturing sector over the next year.
Canada’s trade in goods
In 2022, Canada exported and imported $618 billion and $578 billion of goods, respectively (Fig 1). This was 59% and 38% greater than in 2020, when economy was hit hardest by the Covid-19 pandemic and health restrictions. It therefore had a visible trade surplus of $40 billion in 2022. The value of goods traded surpassed that of services. In that same year, Canadian firms spent $578 billion on goods (76% of all imports) and earned $618 billion on exports (79% of all exports).
The latest data on imports and exports of goods by industry shows that the basic metals industry is the largest Canadian exporter. It received $50.4 billion or 26% of all export earnings from the sale of goods.1 Motor vehicles, trailers, and semi-trailers and chemical manufacturers are the second and third largest recipients: they earned $24.9 billion (or 13%) and $16.3 billion (or 8%) each.
1. OECD. OECD Inter-Country Input-Output (ICIO) Tables. Accessed August 2023.
Manufacturers of paper products and wood and products of wood received $13.9 billion (7%) and $12.2 billion (6%), respectively. These five sectors received 60% of all export earnings from the sale of goods.
Manufacturers of food products, beverages, and tobacco spent the most on imports, at $72 billion or 22% of total. Basic metals and auto-manufacturers purchased $35 billion or 11% of the total each. Petroleum and petcoke refining products and wood manufacturers were ranked fourth and fifth within the manufacturing industry in terms total imports, each spending $32 billion (10%) and $21 billion (6%). The same set of industries is highlighted when we focus on imports of goods, the only exception being that chemicals replace wood manufacturers, in fifth position.
Fig 1: Canada exports and imports
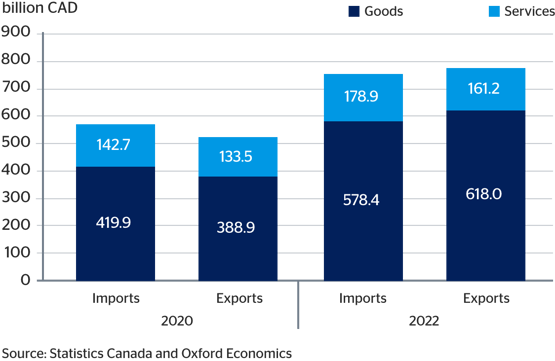
In 2022, 76% of Canada’s export earnings from the sale of goods came from customers in the US. Canada was dependent on its neighbour for 62% of imports.
Multinational corporations play an important role in Canada’s international trade. According to the OECD, foreign-owned firms account for one-half of Canada’s gross exports and almost one-quarter of Canada’s economic activity (GDP) depends on foreign markets, around the same as in the United Kingdom and Italy.2
2. OECD. Canada trade and investment statistical note. 2017.
Fig 1: Canada exports and imports
In 2022, 76% of Canada’s export earnings from the sale of goods came from customers in the US. Canada was dependent on its neighbour for 62% of imports.
Multinational corporations play an important role in Canada’s international trade. According to the OECD, foreign-owned firms account for one-half of Canada’s gross exports and almost one-quarter of Canada’s economic activity (GDP) depends on foreign markets, around the same as in the United Kingdom and Italy.2
2. OECD. Canada trade and investment statistical note. 2017.
Challenges facing firms involved in global commerce
The Covid-19 pandemic aftermath and increased geopolitical tensions may reverse decades of increasing global economic integration and hinder the trade of goods. Many governments around the world responded to the pandemic by restricting exports, most notably of health goods. Russia’s invasion of Ukraine subsequently served to split countries along geopolitical lines and led to sanctions which have disrupted trade.
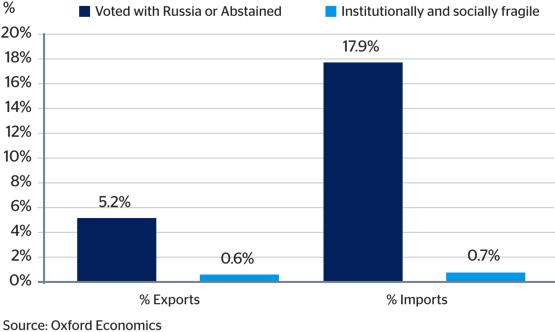
To investigate the potential threats from geopolitical tensions on Canadian trade, be it in the shape of tariffs, sanctions or bans, we look at what proportion of goods is sold to geopolitical allies versus other nations. One way of doing so is to analyze trade with countries that voted the same way as Canada in the United Nations’ General Assembly resolution deploring Russia's invasion of Ukraine.3 About 18% of total goods imported by Canadian companies came from countries that voted against or abstained on the Resolution (Fig. 2).
3. United Nations. 2022. Aggression against Ukraine: resolution/adopted by the General Assembly. Accessed 10 August 2023.
Fig 2: Share of Canada’s exports and imports from countries under geopolitical tensions
The Covid-19 pandemic aftermath and increased geopolitical tensions may reverse decades of increasing global economic integration and hinder the trade of goods. Many governments around the world responded to the pandemic by restricting exports, most notably of health goods. Russia’s invasion of Ukraine subsequently served to split countries along geopolitical lines and led to sanctions which have disrupted trade.
To investigate the potential threats from geopolitical tensions on Canadian trade, be it in the shape of tariffs, sanctions or bans, we look at what proportion of goods is sold to geopolitical allies versus other nations. One way of doing so is to analyze trade with countries that voted the same way as Canada in the United Nations’ General Assembly resolution deploring Russia's invasion of Ukraine.3 About 18% of total goods imported by Canadian companies came from countries that voted against or abstained on the Resolution (Fig. 2).
3. United Nations. 2022. Aggression against Ukraine: resolution/adopted by the General Assembly. Accessed 10 August 2023.
Fig 2: Share of Canada’s exports and imports from countries under geopolitical tensions
China, Vietnam, India, and Bangladesh are the four largest players, with China supplying 76% of the goods imported from the countries that did not vote for the Resolution. Canadian manufacturers sell 5% of their goods to countries that voted against or abstained. Of this [5%], 3.7% went to China, with India, Bangladesh, and Algeria also buying significant amounts.
Another source of risk relates to countries that are institutionally and socially fragile or are affected by violent conflict as judged by the World Bank’s definition for this year.4 Fortunately for stability, Canada exports and imports less than 1% of its goods to and from these countries. Ukraine and Libya are the two countries where Canada has some exposure, but still, as a share of total exports and/or imports, such values are negligible.
4. The World Bank. 2023. FY24 List of Fragile and Conflict-affected Situations. 10 July 2023.
Our baseline forecasts suggest exports of goods (in real terms) will grow relatively strongly in 2023, increasing by 4%.
Key things to watch
- Nearshoring and North American integration: Canadian officials have been encouraging the nearshoring and “friend-shoring” of supply chains over the last year, driven primarily by deteriorating Canada-China and US-China relations. A major aspect of this push is to integrate North American supply chains for critical minerals and semiconductors. US President Joe Biden and Canadian Prime Minister Justin Trudeau seek to create a “cross-border packaging corridor” for semiconductor manufacturing and agreed to make exceptions for “buy American” protectionist policies for Canadian goods and industry. As the US works to boost semiconductor and electric vehicle production, Canadian manufacturing stands to gain from the Biden administration’s industrial policy and reshoring efforts. Likewise, Canada is passing fiscal incentives to promote its clean technology sector to maintain its competitiveness against the US. These incentives will provide opportunities for domestic manufacturers.
- Canada-China tensions: Bilateral ties have been strained for years and will be challenged further by the public inquiry into Chinese interference in Canadian elections. Canadian officials have been calling for the decoupling of critical economic sectors from China. The downturn in relations is driving enhanced national security scrutiny in trade, which in turn will contribute to higher regulatory hurdles for Chinese companies in Canada and Chinese retaliation against any Canadian trade restrictions and perceived diplomatic slights. Furthermore, Canada sought to increase ties to India as a counterbalance to China, however the allegation of the Indian government’s involvement in the killing of a Canadian citizen has agitated relations and will hamper the further development of trade ties between India and Canada.
- Political stability: Canada’s Liberal Party runs a minority government, although it reached an agreement with the New Democratic Party (NDP) to maintain their support in budgetary and confidence matters until June 2025. An election is unlikely over the next year, however the Conservatives have risen in the polls and are well-positioned to win the next election, as they campaign heavily against the rising cost of living and a series of scandals under the Trudeau government. A Conservative-led government is likely to quickly move to abolish the carbon tax, which will ease regulatory costs on manufacturers.
- Sanctions: Ottawa altered the Special Economic Measures Act in 2022 in response to international conflicts in places like Ukraine and Myanmar. Amends included expanding the definition of “property” to include digital assets, enhancing enforcement mechanisms, and introducing an asset forfeiture regime. Ottawa will continue to aggressively enforce its expansive sanctions regime going into 2024. Companies will need to maintain robust screening processes and due diligence in M&A transactions to remain compliant with evolving Canadian regulations.
Macroeconomic risks to the export and import of goods
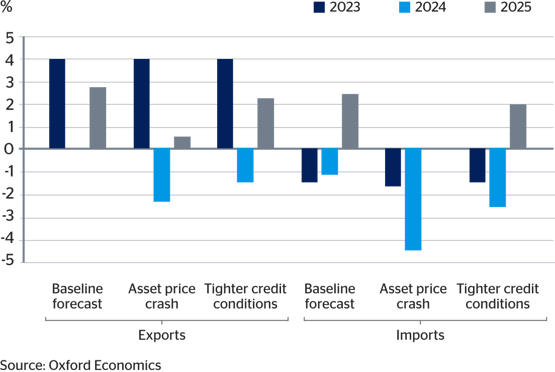
Our baseline forecasts suggest exports of goods (in real terms) will grow relatively strongly in 2023, increasing by 4%.5 They are then predicted to stall in 2024, before beginning to grow again in 2025, as the US and the world economy begin to gather pace. We expect the Canadian economy will enter a recession in H2 2023 that will last into early 2024 as the full impact of wildfires disrupting the economy and past interest rate hikes materialize, and US growth wanes. As a result, imports of goods are forecast to decline by 1.4% in 2023 and 1.1% in 2024. A resumption of import growth of 2.6% is predicted for 2025, as household and corporate spending recovers.
There are significant risks that the Canadian and global economy may be weaker over the next couple of years. We therefore explore what might happen to the trade in goods if there were an asset price crash or credit conditions tightened in two alternative scenarios.6 Both scenarios lead to worse outcomes for Canadian trade in goods, with an asset price crash having a more adverse impact than a tightening in credit conditions. In both scenarios, export volumes are predicted to decline in 2024, before recovering somewhat in 2025. Both scenarios also model an adverse impact on imports of goods. These decline in 2024, before resuming growth under the credit tightening scenario and remaining constant under the asset price one.
5. Oxford Economics. Global Industry Service. Accessed September 2023.
6.Oxford Economics. Global Scenarios Service. Accessed September 2023.
Fig 3: Forecasts of the growth in Canadian exports and imports of goods (in real terms) under various scenarios
Advice for business
Canada sells just over three quarters of its exports to the United States. Being heavily dependent on customers or suppliers from one country may be problematic if trade disputes arise, US regulations change, or the US economy enters recession. Efforts to diversify sales and sourcing to other countries and across the US, should offer some protection from negative economic shocks.
The high dependency on the US as a trade partner raises the importance of the Canadian dollar’s exchange rate with the US dollar. Sudden changes in this exchange rate can adversely impact companies’ operations and profitability. A successful way for larger companies to protect themselves from this is by hedging some of their foreign-exchange risks by buying futures, currency forwards, or options on the currency market. By entering a currency-forward contract with a bank or other financial institution, companies can lock in the exchange rate for the purchase or sale of a specific currency at a future date, ensuring monetary losses due to foreign price fluctuations will not impact their business.
Another strategy is for firms to carry out market research on both their current and prospective trade partners. Companies should be informed about the risks surrounding the other parties’ business locations, transport routes, ESG considerations and other potential barriers that may harm the business. This should also include potential political instability or changes in government, which can disrupt trade and business activity.
The most effective way of minimizing the risks involved in international trade is to ensure business activities are insured. Buying insurance coverage is a way of mitigating financial losses in case something goes wrong. This covers issues such as products damage, theft, and cargo losses.
The trade in goods has allowed Canadian firms to benefit from wider access to inputs into the production process at cheaper prices and greater numbers of potential customers. But it is more risky than domestic transactions. We expect the benefits to continue to outweigh the risks in the future and contribute positively to Canadian GDP in 2024 and 2025.

All dollar amounts referenced in this report are Canadian dollars, unless otherwise stated
Canada sells just over three quarters of its exports to the United States. Being heavily dependent on customers or suppliers from one country may be problematic if trade disputes arise, US regulations change, or the US economy enters recession. Efforts to diversify sales and sourcing to other countries and across the US, should offer some protection from negative economic shocks.
The high dependency on the US as a trade partner raises the importance of the Canadian dollar’s exchange rate with the US dollar. Sudden changes in this exchange rate can adversely impact companies’ operations and profitability. A successful way for larger companies to protect themselves from this is by hedging some of their foreign-exchange risks by buying futures, currency forwards, or options on the currency market. By entering a currency-forward contract with a bank or other financial institution, companies can lock in the exchange rate for the purchase or sale of a specific currency at a future date, ensuring monetary losses due to foreign price fluctuations will not impact their business.
Another strategy is for firms to carry out market research on both their current and prospective trade partners. Companies should be informed about the risks surrounding the other parties’ business locations, transport routes, ESG considerations and other potential barriers that may harm the business. This should also include potential political instability or changes in government, which can disrupt trade and business activity.
The most effective way of minimizing the risks involved in international trade is to ensure business activities are insured. Buying insurance coverage is a way of mitigating financial losses in case something goes wrong. This covers issues such as products damage, theft, and cargo losses.
The trade in goods has allowed Canadian firms to benefit from wider access to inputs into the production process at cheaper prices and greater numbers of potential customers. But it is more risky than domestic transactions. We expect the benefits to continue to outweigh the risks in the future and contribute positively to Canadian GDP in 2024 and 2025.
All dollar amounts referenced in this report are Canadian dollars, unless otherwise stated
This report has been developed for QBE by Control Risks and Oxford Economics
This report has been developed for QBE by Control Risks and Oxford Economics
Building Supply Chain Resilience
Understand and manage risk in your supply chain
More like this
Sign-up to be notified about future articles from the Sector Resilience Series, and other thoughts, reports or insights from QBE.
Subscribe now